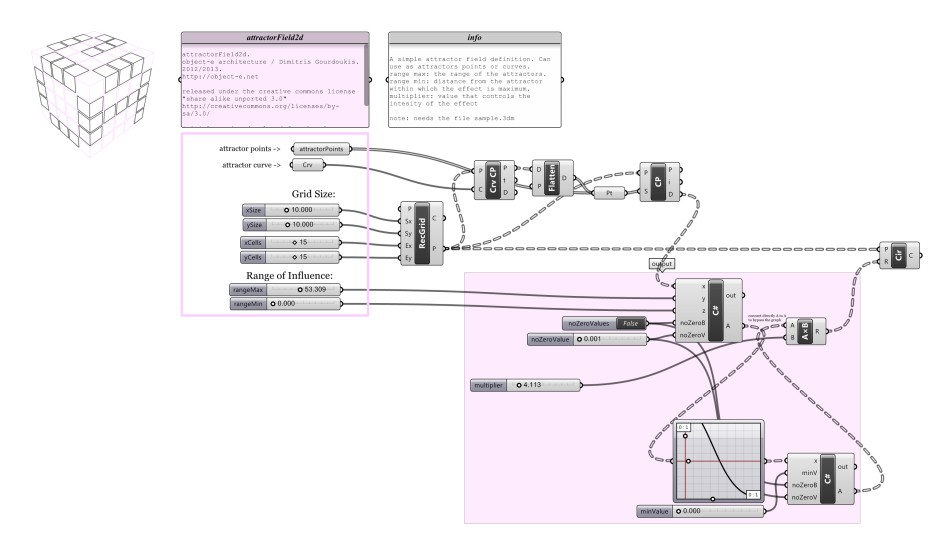
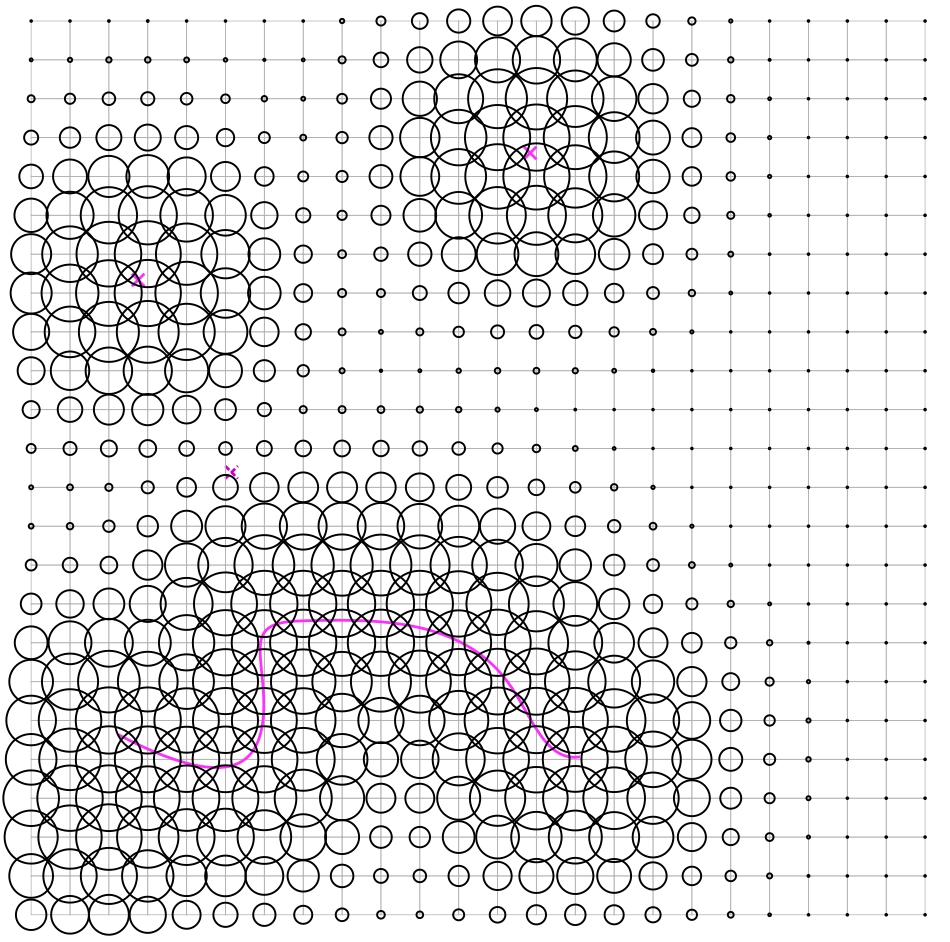
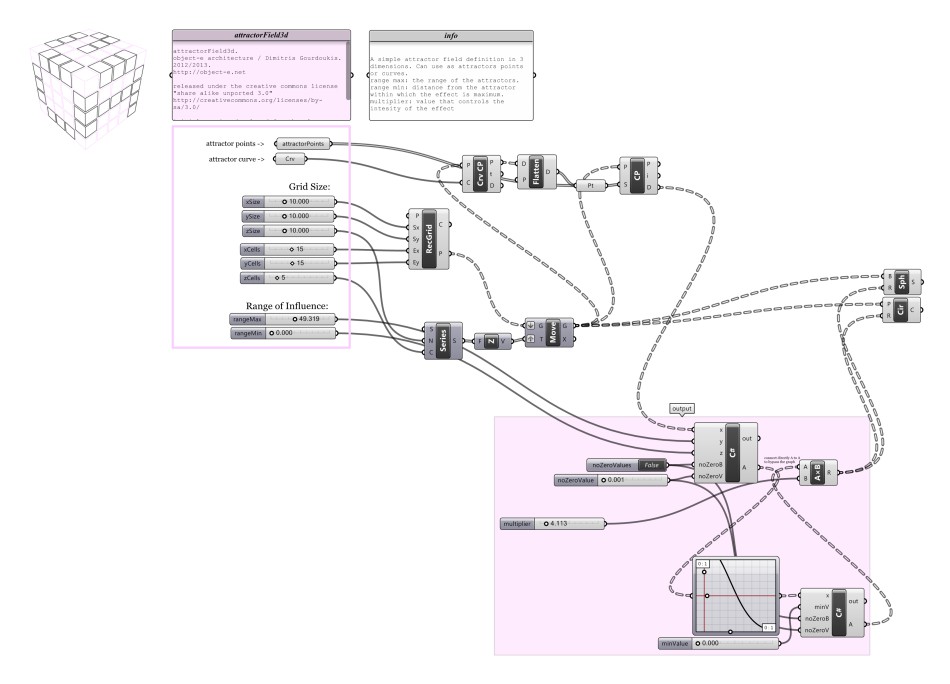
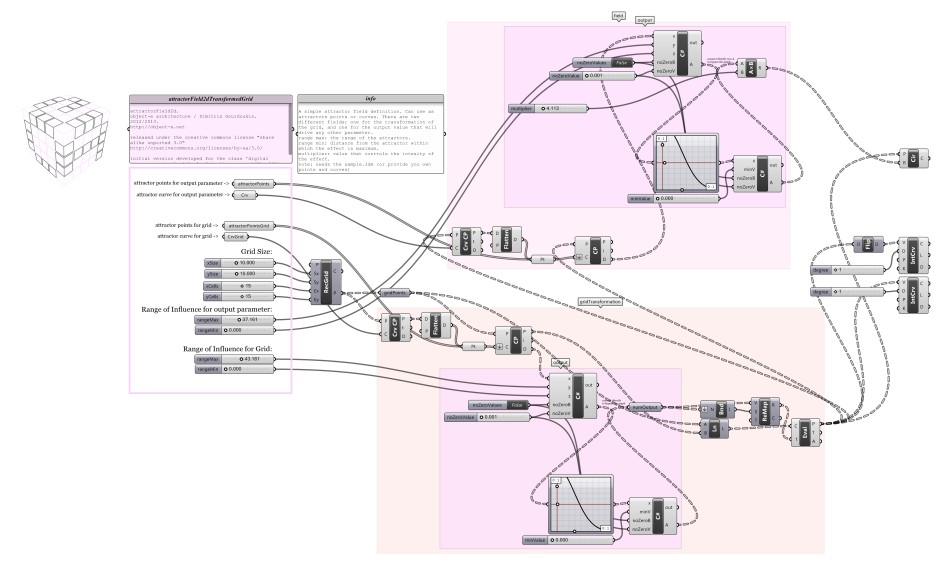
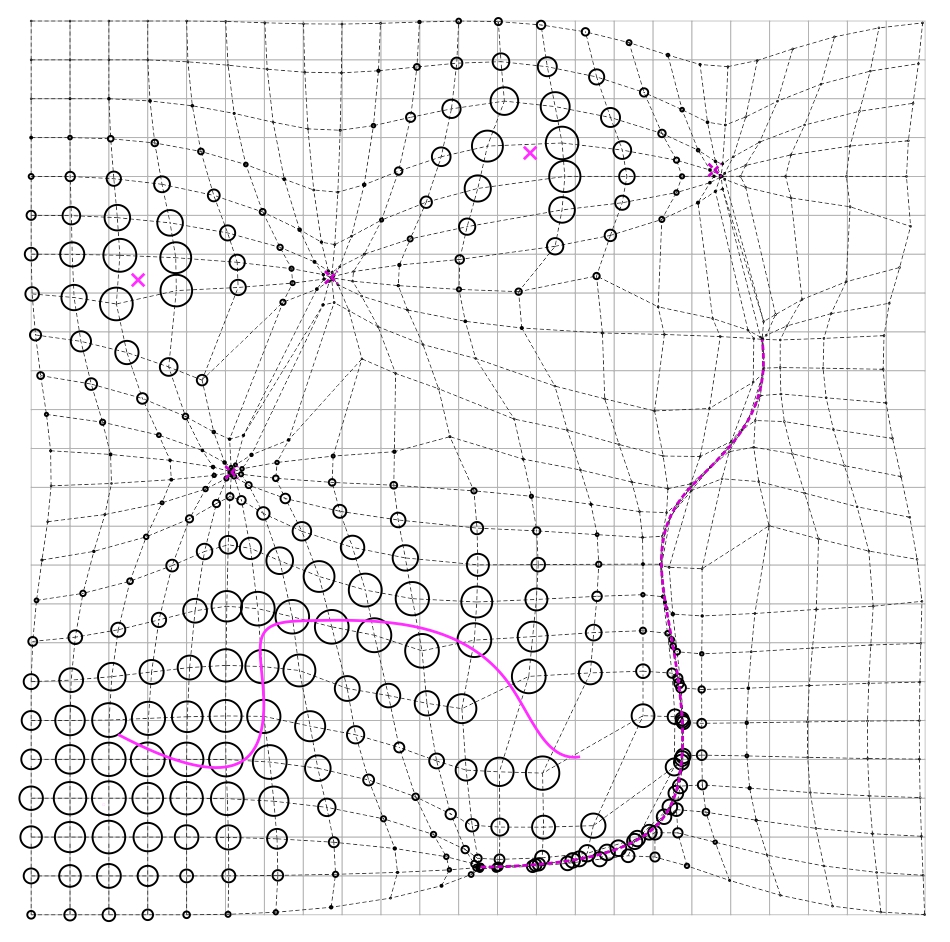
These are 4 grasshopper definitions (download at the end of this page) that generate distance based attractor fields. All 4 are based on the same simple idea (explained below) implemented for different situations. They have been developed over the last 6 year mostly in order to help students, in the various studios and classes that I have been teaching, to experiment with simple field formations. Below the parameters are explained for the object_e_attractorField2d.gh file, but apply the same for all 4 files.
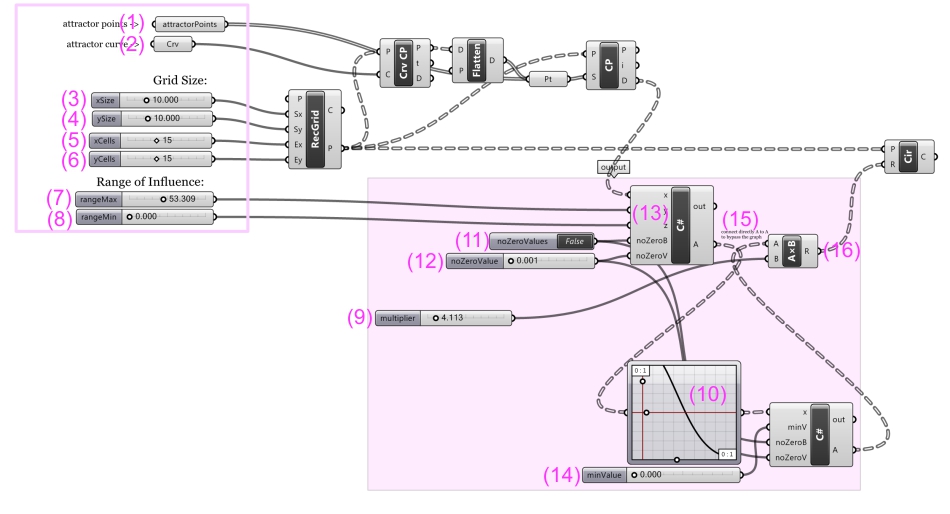
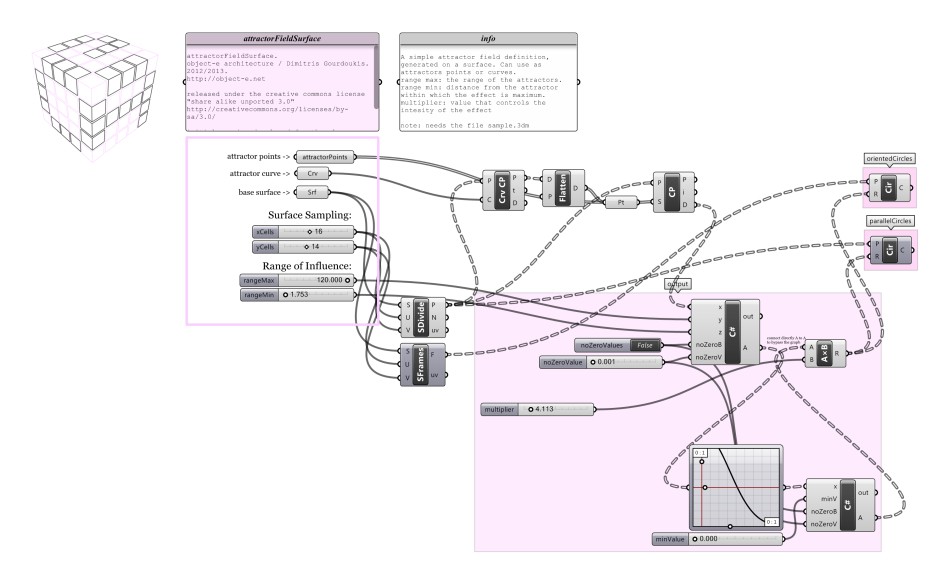
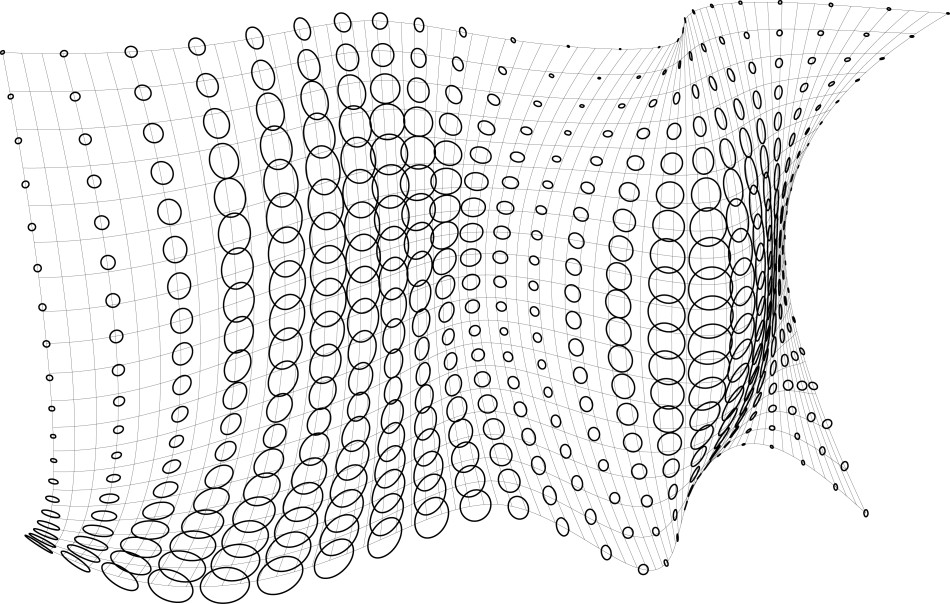
The definition takes as input from rhino 1 or several points (1) or/and one or several curves (2). Those are acting as the ‘attractors’ for the field. A grid of points is created (use parameters 3-6). For each point in the grid a value is generated, based on the distance of each point to the closest attractor (either point or line). Each point is affected only by one attractor (the closest), but the definition can be easily adapted to use influence from several attractors at once quite easily. The output of the definition is one value for each point of the grid that can then be used to control any property (here as an example it controls the radii of circles positioned on the points).
Parameters:
(1): point attractors
(2): curve attractors
(3-6): definition of the grid (number of cells and distance between them).
(7): rangeMax: this is the range of the attractors (the same range for all of them). In other words it is the distance around the attractor within which the final output value will be affected. Points within this distance will have a value between 0 and 1 (the closer to the attractor, the closer to 0). Points further away from this distance will have a value of 1 (or whatever value specified at (14)). (note that in the example here, the final output value is inverted by the graph component (10), therefore points further away have smaller values)
(8): rangeMin: this is the range within which the points will get a minimum or maximum value. In other words, points within this distance around the attractor(s) will get the minimum possible value (or maximum if the function is inverted along the way) and will not be affected by what ever function is used to define the value. Setting this to 0.0 will have no effect. Setting this to a value higher than rangeMax will result in all the points having the same (maximum or minimum) value.
(9): multiplier: a simple multiplier that increase (values >1.0) or decrease (values < 1.0) the effect of the field.
(10). graphMapper: this can be used to visually control the effect of the field. It remaps according to the graph the values coming out of the first C# component (13).
——————— the above parameters offer the main controls. the ones below are for fine tuning and can be left unchanged in most cases.
(11) noZeroValues: a boolean variable. If set to 1 (true) then there will be no instances of the output value equal to 0. Instead values that would have been equal to 0 will now be set to the value specified at parameter 11. This is true for the values of points within rangeMax. This parameter has a visible effect only if rangeMin > 0. If rangeMin is set to 0, then this will have no effect. If this parameter is set to false, then the point that will get a value of 0 are the points that are within rangeMin (have a distance to attractors smaller than rangeMin). Setting this to true can be useful in several cases, for example if the final output will be later used as a denominator in a division. It will also eliminate the generation of null elements later on.
(12). noZeroValues: value to be used if (11) is set to true.
(14). minValue: this can be used to set a minimum value for all the points. If set to 0 it has no effect. If set to any other value, any of the points that have a value < minValue will get minValue as their final value. Note that even though minValue will overlap at some specific cases with noZeroValue, they have a different function. noZeroValue operates only on the points within the rangeMin and before the graph component is applied. minValue operates on all the point and after the graph component. (Therefore, if the graph component is used, then minValue can make sure that no 0 values are generated.)
(15). (13) can be connected directly to (16) so that the graph component can be bypassed. The function of the field can be directly and much more precisely controlled inside the first C# component (13). The current function that defines the values is distanceFromClosestAttractor/rangeMax (x/y). Changing this to 1 – distanceFromClosestAttractor/rangeMax (1 – x/y) will invert the values.
the other 3 files:
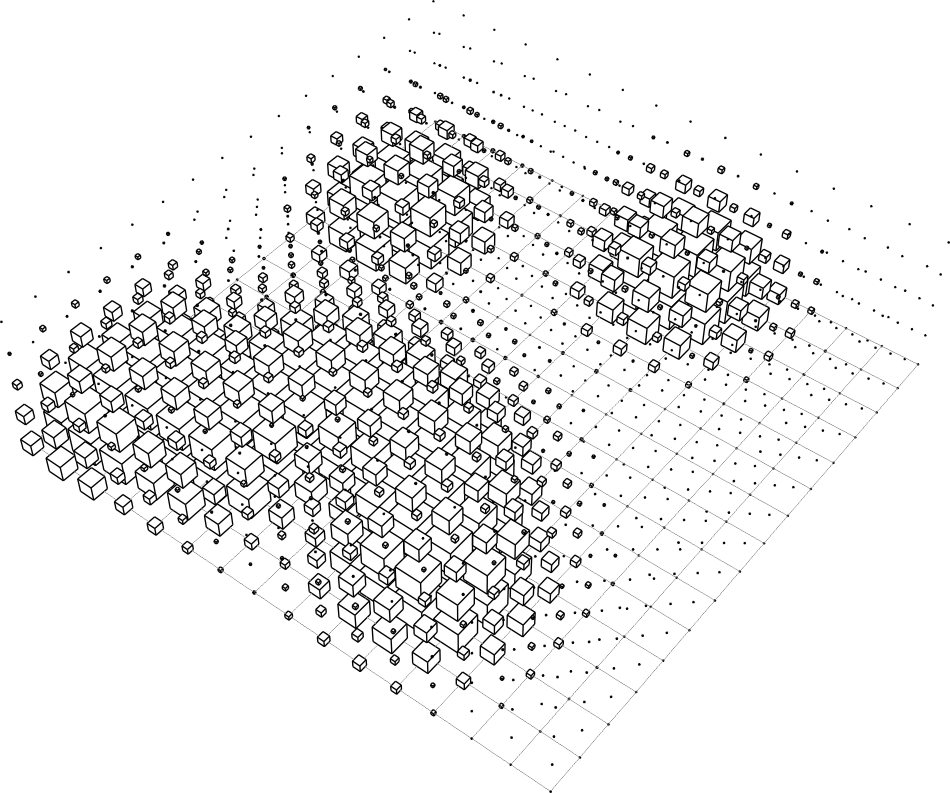
object_e_attractorField3d.gh: the same as object_e_attractorField2d.gh, but on a 3-dimentional grid.
object_e_attractorField2dTransformedGrid.gh: two separate fields operating at the same time. The first is the same with the one used in object_e_attractorField2d.gh. The second is transforming the initial grid under the effect of a different set of attractors.
object_e_attractorFieldSurface.gh: another 2-dimentional field that is distributed on a user-defined surface instead of the xy plane.